
Neighbourhood
Guadiana, San Miguel de Allende
Guadiana is the address buyers name when they want Centro without Centro's noise. It is also the address about which the least data exists.
- US$500k – 2m
- Asking range (no closed-sale data exists)
- MXN 50k – 85k
- Asking price per m²
Guadiana prices level with or above Centro Historico on asking-price evidence, carries roughly a dozen listings at any one time, and has no measured appreciation figure of any kind. It suits a buyer paying for quiet and position rather than for a documented return.
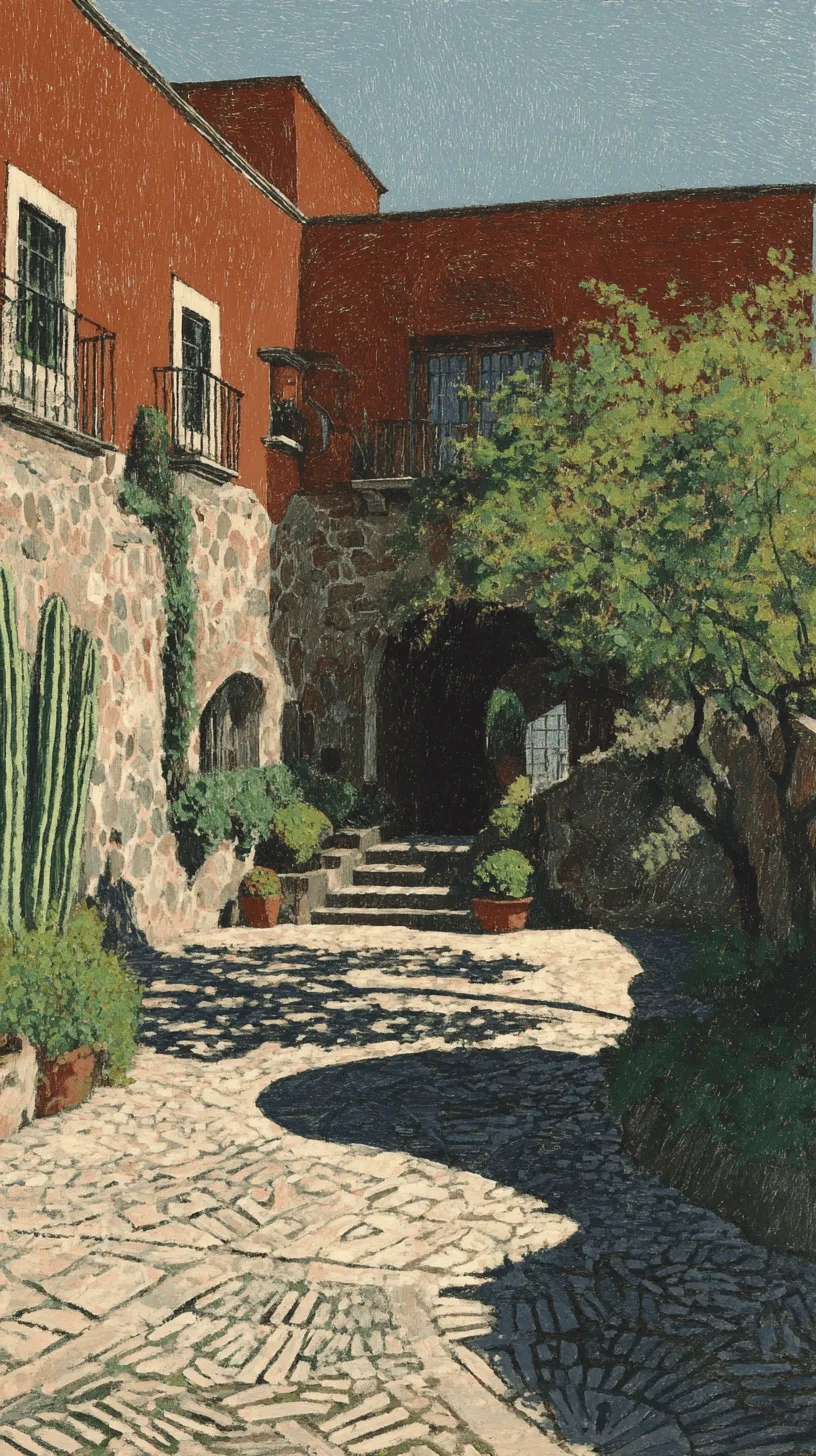
Guadiana is the colonia immediately south and east of Centro Historico, anchored on Parque Juárez and the Mercado Sano organic market. Three brokerages describe it in almost the same words: flat, upscale, mostly residential, park-anchored, with most of its periphery a short walk from the Jardín and its eastern edge climbing the hillside. One of them calls it a fully gentrified neighbourhood. That description is the entire published record of what Guadiana is.
What follows is everything that has been published about what Guadiana costs, plus a longer list of the things that have not been. Both lists matter. Guadiana is the address a certain kind of buyer arrives already wanting, and the gap between the confidence of that wanting and the thinness of the evidence behind it is the largest in the city.
What Guadiana costs
Two independent price series exist for Guadiana. Neither is a record of sales.
| Figure | Value | Basis | Source and date |
|---|---|---|---|
| Narrative price range | Roughly $500,000 to $2,000,000 | Agent copy | Berkshire Hathaway HomeServices Colonial Homes, undated page retrieved 23 July 2026 |
| Live listings on the same page | $750,000 to $3,295,000 | Asking prices | Same page, same date |
| Price per square metre | MXN 50,000 to 85,000 | Listing-portal scrape | TheLatinvestor, 16 June 2026 |
| Whole-property range | MXN 10m to 30m (US$573,000 to $1.72m) | Listing-portal scrape | TheLatinvestor, 16 June 2026 |
| Land per square metre | MXN 16,000 | Aggregator table, sources not attributed per figure | TheLatinvestor, 2 April 2026 |
| Active listings | 11 | One brokerage’s listing book | Realty San Miguel colonias directory, 23 July 2026 |
The first thing to notice is that the brokerage page contradicts itself. Its narrative tops out at $2 million while the properties it is advertising on the same screen reach $3.295 million. That is not a rounding difference. It is the gap between the range an agent uses to describe a neighbourhood in conversation and the range the neighbourhood is actually being offered at.
The second thing is that the two series measure different markets and should never be averaged together. The aggregator’s citywide figures — a median whole-property price of MXN 5.2 million, about US$298,000, and an average of MXN 6.8 million, about US$390,000 — sit far below the closed-sale average of $568,829 that the leading local brokerage reported for 2025. The portals capture the peso-denominated domestic segment; the brokerage MLS captures the dollar-denominated foreign-buyer segment. A Guadiana buyer is almost certainly shopping in the second one.
Currency compounds this. Academic work on San Miguel records that prices here are quoted predominantly in dollars, so the headline number a foreign buyer sees does not move when the peso does. What moves are the peso costs behind it: construction, labour, predial, closing costs. Over 2025 the spot rate strengthened to close the year near 18.00 MXN per dollar, and stood at 17.46 on 23 July 2026 on the ECB reference. Annual averages are a different measure and are routinely confused with the spot move — the IRS yearly averages were 18.330 for 2024 and 19.212 for 2025. Converting MXN 10 to 30 million at today’s rate is what produces the dollar figure above, and that conversion is the only reason the two series look comparable at all.
Where Guadiana sits against the rest of the city
The per-square-metre table below is the only neighbourhood-level price-per-m² dataset that exists publicly for San Miguel de Allende. It is a listing-portal scrape published by a content aggregator that sells property investment packs, with no stated sample size and no stated method. It is included because it is the only one, not because it is good.
| Colonia | Asking price per m² (MXN) | Land per m² (MXN) |
|---|---|---|
| Parque Juárez | 55,000 – 95,000 | not listed |
| Centro Historico | 45,000 – 90,000 | 18,000 |
| Guadiana | 50,000 – 85,000 | 16,000 |
| Balcones | 35,000 – 65,000 | 14,000 |
| Guadalupe | 35,000 – 60,000 | not listed |
| San Antonio | 32,000 – 55,000 | 11,000 |
| Atascadero | 30,000 – 55,000 | 12,000 |
| La Lejona | 25,000 – 38,000 | not listed |
| Zirándaro | 22,000 – 34,000 | 8,500 |
| Olimpo / Santa Julia | 16,000 – 25,000 | 5,800 |
| Citywide | median 28,500, average 34,500 | average 10,650 |
Read carefully, the table says something more precise than “Guadiana is expensive”. Guadiana’s built-property band overlaps Centro’s almost entirely: a higher floor, a slightly lower ceiling. The separation is clearer in land, where Guadiana at MXN 16,000 per square metre is second only to Centro’s MXN 18,000 among the twelve colonias listed, and roughly half as much again as the city average of MXN 10,650. If the prestige premium here is real, it is being paid for position and plot rather than for the building.
Two cautions. The land and built-property figures come from pages published ten weeks apart by the same publisher, which has elsewhere given two irreconcilable figures for San Antonio within that interval. And its Centro land figure of MXN 18,000 sits well below its own Centro built-property figure, which is arithmetically possible but unexplained. Treat the ordering as more reliable than any individual number.
The appreciation figure that does not exist
There is no measured appreciation rate for Guadiana. There is no measured appreciation rate for any San Miguel colonia. No repeat-sales index, no hedonic index and no MLS time series broken out by colonia has been published, and Mexico’s official house-price index covers only mortgage-financed purchases, which is close to useless in a market local brokers describe as primarily a cash market.
The one publisher circulating neighbourhood appreciation estimates gives 8 to 10 per cent citywide over the preceding twelve months, 10 to 13 per cent for San Antonio, 9 to 12 per cent for Guadalupe and 9 to 12 per cent for Centro Historico. Guadiana does not appear. The aggregator that is willing to model a number for three colonias declined to model one here.
Set against that, here is what was actually counted, all of it by one brokerage from its own view of the local MLS.
| Measure | 2024 / earlier | 2025 / 2026 |
|---|---|---|
| Average resale sale price | $650,462 (full-year 2024) | $568,829 (full-year 2025) |
| Sales above $2 million | 19 (2024) | 12 (2025) |
| Active listings citywide | 593 (May 2025) | 860 (May 2026) |
| Average months of inventory | 17.6 (Jan–May 2025) | 29.6 (Jan–May 2026) |
| Closings year to date | 190 (Jan–May 2025) | Unresolved — the source’s own posts conflict (197 through May, 186 through June) |
The average price fell 12.5 per cent, but that is a mix effect at least as much as a price effect — the brokerage attributes roughly half of it to the collapse in luxury sales, and seven fewer sales above $2 million in a city that closes around forty homes a month will move a mean on their own. It should not be published as minus 12.5 per cent appreciation, and it is not published as such here. What it does establish is that the direction of the measured citywide data and the direction of the modelled neighbourhood estimates are opposite. When a number that has been counted and a number that has been asserted disagree, the counted one is the one to plan against.
Days on market is the other absence worth naming. The 150-day citywide average that circulates for San Miguel traces to an aggregator page citing a brokerage market update that contains no days-on-market figure at all. No neighbourhood-level days-on-market data exists for San Miguel de Allende in any source. Anyone quoting a Guadiana figure is inventing it.
Eleven listings
The most consequential number on this page is 11.
| Colonia | Active listings |
|---|---|
| Centro | 220 |
| Zirándaro | 55 |
| San Antonio | 48 |
| Los Frailes | 37 |
| La Cieneguita | 30 |
| La Lejona | 26 |
| Guadalupe | 18 |
| Ojo de Agua | 13 |
| Atascadero | 13 |
| Guadiana | 11 |
This is one brokerage’s listing book, drawing on the shared local MLS. It is not a market census, it mixes houses, condos and land, and the directory’s contents shift: a subsequent check of the same page showed a different count for Club de Golf Malanquín and no rows at all for two colonias that had appeared previously. Read it as the shape of supply, not as an inventory audit.
The shape is still the point. Centro carries roughly a quarter of citywide inventory and twenty times Guadiana’s count. A colonia with eleven listings is not a market in the sense that word usually implies. There is no comparable set. A single sale does not establish a price level, two sales of unlike houses do not bracket one, and the price a seller holds out for can persist for a long time without being tested, because nothing else is trading nearby to contradict it. In a city already at 29.6 months of inventory, thin submarkets are where asking prices stay furthest above clearing prices for longest.
This cuts both ways for a buyer. Scarcity is real and the position cannot be replicated. Scarcity is also why a Guadiana property cannot be valued from public evidence, and why any valuation here rests on one agent’s judgement rather than on a checkable record.
Character, terrain and the walk
The qualitative record is consistent across three independent brokerages, which is weak corroboration but better than one source. Guadiana: flat, upscale, mostly residential, anchored on Parque Juárez, with the eastern edge rising onto the hillside. That flatness is the genuinely load-bearing detail, because slope drives both construction cost and real walkability, and it is what separates Guadiana from Atascadero, Balcones and Ojo de Agua.
The walk to the Jardín is claimed at an easy, flat 15 minutes by one brokerage and 10 minutes by another. Both are undated sales pages with an incentive to compress the distance. No measured walking time or distance in metres from any colonia to the Jardín has been published. Note also how the flat framing can mislead elsewhere in town: the same comparison set describes Ojo de Agua as a fifteen-minute downhill walk, which means the return leg is uphill.
Beyond terrain, the published record on Guadiana’s built form is empty. No source publishes typical lot sizes, plot coverage, floor-area ratios or height limits for this or any San Miguel colonia. The municipal building regulation sets heights case by case, judged by street width and neighbouring rooflines, with no numeric cap published. The reputation for larger, greener plots may well be accurate. It is not documented, and a buyer should measure the specific lot rather than trust the colonia’s reputation.
Heritage rules do not follow colonia boundaries
The 1982 presidential decree that governs San Miguel’s historic core covers 0.75 square kilometres comprising 68 manzanas, divided into Perímetros A, B-1 and B-2, and itemises 229 individual addresses as catalogued monuments. Article 5 requires prior application to INAH for any construction, restoration or conservation work within the zone. That is a federal permitting requirement additional to municipal permits, and it is the hardest single constraint on what an owner may do to a building. Separately, the UNESCO inscribed property covers 43.26 hectares with a 40.05 hectare buffer zone.
None of these instruments is drawn by colonia. The decree works from region and manzana references and a street-address list, and no public source maps colonia boundaries against the perimeters. Whether a particular Guadiana house sits inside Perímetro B-2 or outside the zone entirely is a property-level question with a documentary answer, and it belongs in due diligence before an offer, not after. Whether the UNESCO buffer imposes any restriction distinct from the INAH rules is also unresolved: buffer zones are a management concept rather than self-executing law, and the operative Mexican instrument is the 1982 decree plus municipal regulation.
Water, tax and the carrying costs
Guanajuato’s Cuenca Alta del Río Laja aquifer, which underlies the whole municipality, is in documented deficit. CONAGUA’s 2024 determination records recharge of 139.7 million cubic metres a year against 201.68 million of registered extraction, a shortfall of 61.98 million cubic metres, and states in terms that no volume is available for new concessions. Well-drilling vedas covering Allende date to 1958 and 1964. Any buyer contemplating new construction, a pool or extensive planting on a private well should assume water rights must be bought from an existing concession holder rather than newly granted.
On water quality, the most recent public mapping available groups colonias by contamination in well water. Guadiana appears in the cleanest group; Centro appears in the most contaminated. That reporting is from February 2022, gives no numerical thresholds, no well counts and no study period, and should be re-verified against the current monitoring map before it is relied on. It is nonetheless one of the few published metrics on which Guadiana clearly outperforms Centro.
Property tax is low by North American standards and cannot be estimated by colonia. The 2026 Ley de Ingresos sets urban built-property predial at marginal rates from 0.234 per cent of fiscal value up to MXN 500,000, rising in bands to 0.354 per cent above MXN 1.5 million, with suburban built property at a flat 0.207 per cent. Those rates apply to cadastral value, not market value, and Mexican cadastral values typically sit far below market. Converting them into a per-colonia carrying cost requires the municipal tabla de valores unitarios de suelo y construcción, which is referenced by the statute but not reproduced in it and which could not be located in public sources. Until that table is obtained, no honest per-colonia predial estimate can be produced for anywhere in San Miguel.
Rental income, and why Guadiana is absent from it
Guadiana does not appear in the free neighbourhood view of the leading short-term rental data vendor, which names eight San Miguel colonias. Per-neighbourhood rate and occupancy figures sit behind that vendor’s paid tier for all eight in any case. There is therefore no Guadiana rental performance data at any price point in the public record.
The citywide picture over the twelve months to June 2026 is the only benchmark available: average daily rate $210, occupancy 29.9 per cent, RevPAR $64, 2,285 active listings, average annual revenue per listing $17,033, and a booking lead time of 46 days. Seasonality is severe — February, March and December average $2,720 a month at 38.4 per cent occupancy, while May, June and September average $1,697 at 26.2 per cent. Set the citywide median of $13,152 — or the mean of $17,033, which a dozen top-decile listings pull upward — against a Guadiana entry price and the implied yield before costs is low single digits either way.
Short-term rental regulation is the one part of this picture that is documented to primary-source level, and it cuts the wrong way. A property used for lodging requires a specific land-use permit, and Article 24 fracción XIV of the 2026 Ley de Ingresos sets it at MXN 45,000 per fiscal year — about US$2,577 at the European Central Bank reference rate of 17.4601 on 23 July 2026. It is annual rather than one-off, and it is flat, so it does not scale down with a quiet year: set against the citywide average annual revenue of $17,033 it is roughly 15 per cent of gross before anything else is deducted. Article 24 fracción XIII inciso d) adds a one-time MXN 11,248.64 to authorise the change of use, so a converting owner pays both in year one. What is unquantified is enforcement rather than the fee: no count of how many San Miguel properties actually hold and pay the permit has been published for 2026 by the municipality or anyone else. Anyone underwriting a Guadiana purchase on rental income is stacking a documented and non-trivial compliance cost on top of a revenue line nobody has measured.
Security, at the only resolution that exists
No crime data is published at colonia level for San Miguel de Allende, so nothing specific to Guadiana can be said. At municipal level the picture is two-sided and both sides belong on the page. San Miguel recorded 3 homicides in June 2026 against León’s 45, Salamanca’s 32 and Irapuato’s 25. Over the twelve months from September 2024 to August 2025 it recorded 88 homicides, a rate of 49.3 per 100,000, making it Mexico’s 50th most violent municipality. Statewide, Guanajuato remains Mexico’s highest-homicide state in absolute terms, with 789 intentional homicides in the first half of 2026 per SESNSP — though an independent press tally counts 1,141 victims for the same state and period, a 45 per cent discrepancy that neither source reconciles.
San Miguel is not insulated from events elsewhere in the state, and the claim that it is should be treated as marketing. In February 2026, cartel reprisal violence reached roughly 23 Guanajuato municipalities including this one, with an arson incident in San Miguel de Allende on 22 February that suspended business and university activity, and a body showing signs of violence found in the municipality on 25 February.
The case for and against Guadiana
The case for is short and mostly true: a flat walk to the Jardín, a park, quiet, and a position that cannot be reproduced because there are only eleven of it for sale.
The case against is that everything a buyer would want to verify about that proposition is unverifiable. The price range is asking-price evidence from a source that contradicts itself. The appreciation rate does not exist. Days on market does not exist. Rental performance does not exist. Lot norms and height limits do not exist. Heritage status is address-specific and not published by colonia, and the predial calculation is blocked by a missing municipal table.
That does not make Guadiana a bad purchase. It makes it a purchase that has to be justified on the property and the position rather than on the numbers, because the numbers a seller presents are not measurements. Peer-reviewed census work found 1,803 foreign residents inside the seven tracts covering the UNESCO polygon, 42 per cent of the municipality’s 4,312 foreign-born population and 8 per cent of those tracts’ 22,405 residents, with the researcher noting census figures are conservative. Nothing published maps that concentration onto Guadiana specifically. The same work records an average San Miguel property price of US$520,000 in 2017, which is the longest price baseline anyone has published for this city.
The defensible reasons to buy in Guadiana are the lot itself, the walk to the Jardín done once with the shopping in hand, a confirmed water source and a pulled INAH status for the address. The indefensible reason is a table showing that the neighbourhood appreciates. No such table has been published.
All figures in USD unless stated. Every transaction figure on this page traces to one brokerage’s view of the local MLS; San Miguel de Allende has no public transaction registry, and no independent body audits these numbers.
Who buys here
- Buyers who want to walk to the Jardín without living inside the tourist flow.
- Cash purchasers comfortable with a thin, illiquid submarket in which a single sale is not a comparable set.
- Long-stay residents rather than short-term rental operators. No vendor publishes Guadiana rental performance at any price.
- Buyers willing to verify heritage status, water source and cadastral value address by address rather than by colonia name.
Sources
- Berkshire Hathaway HomeServices Colonial Homes San Miguel — Guadiana neighbourhood page (narrative price range, live listing span, neighbourhood description) · Retrieved 23 July 2026; page carries no publication date
- Realty San Miguel — colonias directory (active for-sale listing counts by colonia) · Retrieved 23 July 2026
- Realty San Miguel — May 2026 market update (citywide active listings, months of inventory, closings year to date) · May 2026
- Realty San Miguel — December 2025 market update (average resale price 2024 and 2025, luxury transaction counts) · Full year 2025
- TheLatinvestor — price per square metre by neighbourhood, listing-portal derived (asking prices, no stated method) · Published 16 June 2026
- TheLatinvestor — land price per square metre by neighbourhood, and claimed 12-month appreciation by neighbourhood · Published 2 April 2026 and 19 June 2026
- The Clark Group — San Miguel de Allende neighbourhoods page (stated walking times to the Jardín) · Retrieved 23 July 2026; page undated
- Coldwell Banker SMART and San Miguel Scene — neighbourhood character and terrain descriptions · Retrieved 23 July 2026; San Miguel Scene page dated 1 March, year not stated
- Decreto presidencial, Diario Oficial de la Federación, 28 July 1982 — INAH zona de monumentos históricos, via Sistema de Información Cultural · Decree of 28 July 1982; in force
- UNESCO World Heritage Centre — Protective town of San Miguel de Allende, inscribed property and buffer areas · Inscribed 2008; figures current July 2026
- CONAGUA, Gerencia de Aguas Subterráneas — Cuenca Alta del Río Laja aquifer (clave 1108) availability determination · Study dated 2024; REPDA cut-off 30 December 2022
- Ley de Ingresos para el Municipio de San Miguel de Allende 2026, Decreto 160 — Article 4 (predial rates), Article 24 fracción XIV (annual land-use permit for lodging) and Article 24 fracción XIII inciso d) (change of use to lodging) · Published Periódico Oficial 30 December 2025; in force for fiscal 2026
- AirROI — San Miguel de Allende short-term rental market data, citywide · Trailing twelve months, July 2025 – June 2026
- Discover San Miguel de Allende, reporting Caminos de Agua's well-water monitoring map (colonia groupings) · Published 23 February 2022
- David Navarrete Escobedo, 'La gentrificación trasnacional en América Latina: el caso de San Miguel de Allende', Iztapalapa 43(93), 2022, via SciELO México · INEGI 2010/2020 census data; published 2022
- SESNSP via Mexico News Daily, Periódico AM 'Ejecutómetro', and elcri.men — Guanajuato and San Miguel de Allende homicide data · June 2026 and the September 2024 – August 2025 window
- European Central Bank reference rate (via Frankfurter) — USD/MXN on 23 July 2026; IRS yearly average exchange rates for 2024 and 2025 · 23 July 2026
Common Questions
How much does a house in Guadiana, San Miguel de Allende, cost?
Two published series exist and they do not agree. A Berkshire Hathaway HomeServices brokerage page describes Guadiana homes as running roughly $500,000 to $2 million, while the live listings displayed on that same page run from $750,000 to $3,295,000. A separate listing-portal aggregator gives a whole-property range of MXN 10 to 30 million, about US$573,000 to $1.72 million, and MXN 50,000 to 85,000 per square metre. All of these are asking prices. No recorded sale price for any Guadiana property is published anywhere, because Mexico's Registro Público de la Propiedad does not publish aggregated statistics and San Miguel has no public transaction registry.
Is Guadiana more expensive than Centro Historico?
On the only published price-per-square-metre table, the two overlap: Guadiana at MXN 50,000 to 85,000 against Centro Historico at MXN 45,000 to 90,000, with the Parque Juárez pocket above both at MXN 55,000 to 95,000. On land value the same publisher puts Guadiana at MXN 16,000 per square metre, second only to Centro's MXN 18,000 and well above the city average of MXN 10,650. These are asking-price estimates from listing-portal scrapes, not sales, so the honest answer is that Guadiana prices in the same band as Centro and that no dataset exists which could rank them by what buyers actually paid.
How much has property in Guadiana appreciated?
Nobody has measured it. There is no repeat-sales index, no hedonic index and no MLS time series broken out by colonia for San Miguel de Allende. The one aggregator that publishes neighbourhood appreciation estimates gives figures for San Antonio, Guadalupe and Centro Historico but none for Guadiana. The measured citywide numbers point the other way: the average resale price recorded by the leading brokerage fell from $650,462 in 2024 to $568,829 in 2025, and average months of inventory rose from 17.6 to 29.6 over the first five months of 2026. Any Guadiana appreciation percentage in circulation is an assertion, not a measurement.
How far is Guadiana from the Jardín Principal?
Agents disagree and nobody has measured it. One brokerage calls it an easy, flat 15-minute walk; another states 10 minutes. Both are undated sales pages with an obvious incentive to compress the distance. No source publishes verified walking times or distances in metres from any colonia to the Jardín. What is consistent across three independent brokerages is that most of Guadiana is flat, which matters more than the minute count, because the eastern edge of the colonia climbs the hillside and a flat outbound walk elsewhere in town often means an uphill return.
Is Guadiana inside San Miguel's protected historic zone?
That has to be checked address by address, not by colonia name. The 1982 presidential decree defines the zona de monumentos históricos as 0.75 square kilometres comprising 68 manzanas, divided into Perímetros A, B-1 and B-2, and itemises 229 individual addresses as catalogued monuments. Article 5 requires prior application to INAH for any construction, restoration or conservation work inside the zone, on top of municipal permits. The decree works from block and perimeter references, and no public source maps colonia boundaries against them, so the only reliable check is on the specific property.
Can you run a short-term rental in Guadiana?
No published data supports underwriting one. AirROI names eight San Miguel neighbourhoods in its free market view and Guadiana is not among them, and per-neighbourhood occupancy and rate figures sit behind its paid tier in any case. The citywide picture is sobering: average daily rate $210, occupancy 29.9 per cent, and average annual revenue of $17,033 per listing over the twelve months to June 2026. The compliance cost, unlike the income, is documented. Article 24 fracción XIV of the 2026 Ley de Ingresos sets the specific land-use permit for property used for lodging at MXN 45,000 per fiscal year, about US$2,577 at the European Central Bank reference rate of 17.4601 on 23 July 2026, with a separate one-time MXN 11,248.64 under fracción XIII inciso d) to authorise the change of use. So the cost of compliance here is knowable to the peso and the revenue that would have to carry it is not.
San Miguel de Allende · Heritage Equity
The report no agent will send you.
The SMA Wealth Intelligence Report. Transaction data, neighbourhood appreciation, and the full short-term rental yield distribution. No commission agenda, because we do not earn one.