
Neighbourhood
Guadalupe: San Miguel de Allende's Arts District, Tested
Guadalupe is the neighbourhood most often called San Miguel's best value. The parts of that claim that can be checked are thin, and the parts that cannot be checked are the ones doing the persuading.
- US$315k – 688k
- Asking range (no closed-sale data exists)
- MXN 35k – 60k
- Asking price per m²
A cheaper way to buy flat walking access to the Jardin, on evidence that is qualitative rather than quantitative.
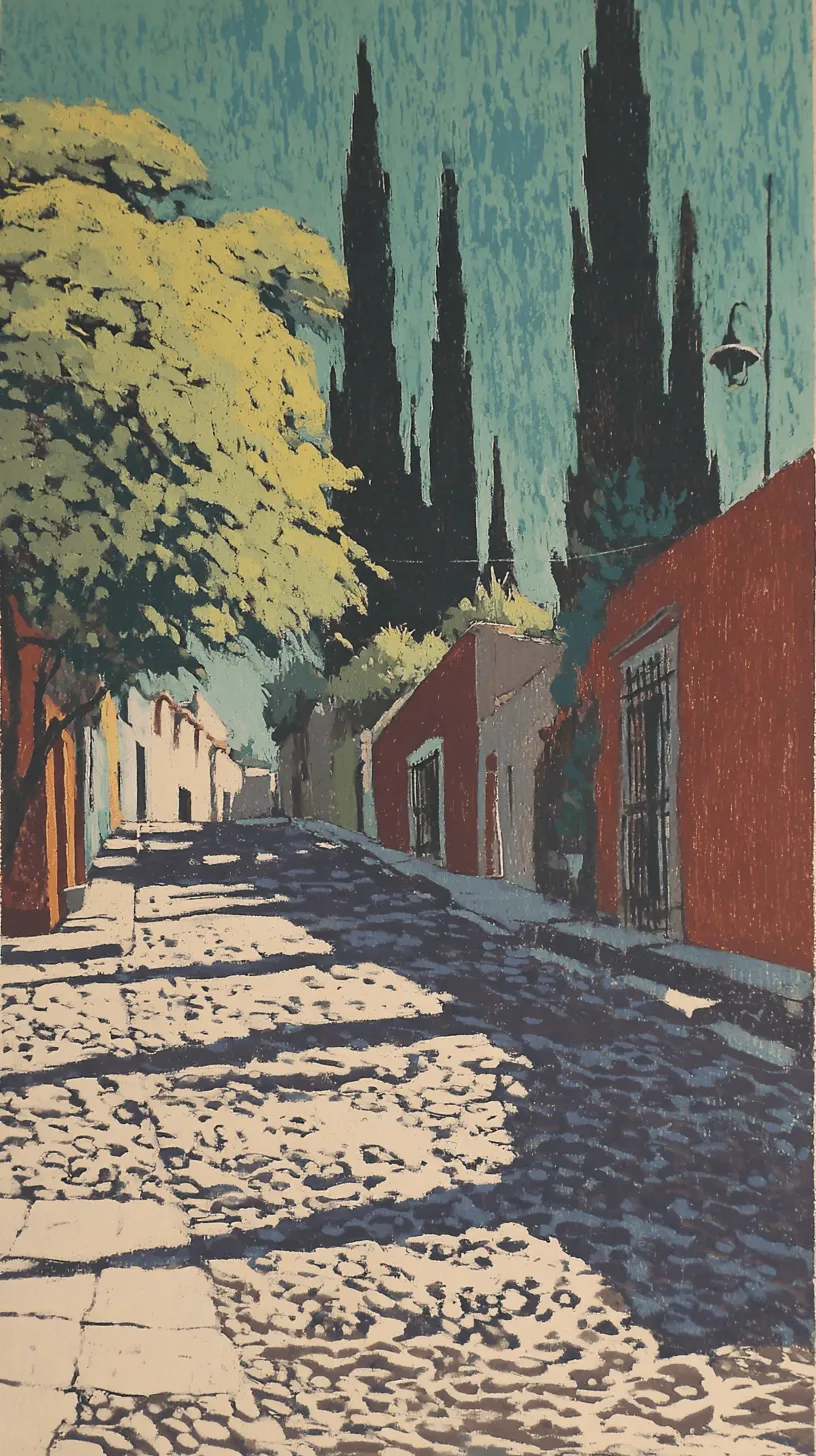
Guadalupe is the colonia most often named when someone in San Miguel de Allende wants to point at value. The description is always similar: the arts district, murals, Fábrica La Aurora, flat streets, a few minutes’ walk to the Jardin, and prices below Centro. It is a persuasive picture, and this publisher has repeated a version of it before.
This page tests it. The conclusion is that roughly half the thesis holds and roughly half is narrative wearing the clothes of analysis. The half that holds is about location, terrain and relative price. The half that does not hold is the part that sounds most like an investment case: appreciation and rental yield. Neither of those is measured for Guadalupe by anyone.
What is actually established about Guadalupe
Three brokerages describe Guadalupe in mutually consistent terms: colourful, with a strong artistic community, home to the Fábrica La Aurora arts and design hub, and gentrifying. They are commercial sources with a commission motive, and the descriptions are undated. Consistency across independent firms is weak corroboration rather than evidence, but it is what exists.
The one load-bearing detail in that material is terrain. Guadalupe is flat, as are San Antonio and Guadiana. Atascadero, Ojo de Agua and Balcones sit on the hillside. Slope drives construction cost and it decides whether a stated walking time is real. That distinction is worth more to a buyer than any of the adjectives around it.
On distance, The Clark Group describes Guadalupe and San Antonio together as a “flat few minutes walk to the center”. That is a selling agent’s figure on an undated page, and the same category of claim conflicts elsewhere: Guadiana is variously described as a 10-minute and a 15-minute walk by two different firms. No source publishes a measured distance in metres or a verified walking time from any San Miguel colonia to the Jardin. Walk it yourself, at the time of day you would actually walk it.
Supply: Guadalupe is a thin submarket
The closest thing to neighbourhood-level market data in San Miguel is one brokerage’s count of its own active listings by colonia.
| Colonia | Active listings |
|---|---|
| Centro | 220 |
| Zirándaro | 55 |
| San Antonio | 48 |
| Los Frailes | 37 |
| La Lejona | 26 |
| Guadalupe | 18 |
| Independencia | 15 |
| Ojo de Agua | 13 |
| Atascadero | 13 |
| Guadiana | 11 |
Read this as one firm’s listing book, not as a market census. It draws on the shared local MLS but it is not audited, it mixes houses, condos and land, and a subsequent check found some rows on the same page no longer matching the figures recorded here. The shape is still informative. Centro alone carries about a quarter of the inventory in this book. Guadalupe carries 18 listings.
Eighteen is not a comparable set. It means that in any given month a buyer in Guadalupe may be choosing between a handful of properties that share a colonia name and almost nothing else, and that a seller has no local price signal to work from. Thin submarkets produce wide bid-ask gaps and long, unrecorded negotiations. That is a structural feature of buying here, and it cuts against the idea that Guadalupe behaves like a tracked asset class.
Price: the entry-point case is the strongest part of the thesis
| Colonia | Asking price per m² (MXN) | Whole-property asking range (MXN) |
|---|---|---|
| Parque Juárez | 55,000 to 95,000 | 12m to 35m |
| Guadiana | 50,000 to 85,000 | 10m to 30m |
| Centro Histórico | 45,000 to 90,000 | 8.5m to 20m |
| Balcones | 35,000 to 65,000 | 8m to 24m |
| Guadalupe | 35,000 to 60,000 | 5.5m to 12m |
| San Antonio | 32,000 to 55,000 | 4.8m to 10m |
| Atascadero | 30,000 to 55,000 | 6m to 18m |
| La Lejona | 25,000 to 38,000 | 3.5m to 7m |
| Zirándaro | 22,000 to 34,000 | 3m to 6m |
Guadalupe’s whole-property range of MXN 5.5m to 12m converts to roughly US$315,000 to US$688,000. Against Centro’s MXN 8.5m to 20m, the entry point is genuinely lower, and the price-per-square-metre gap points the same way.
Four caveats belong with that table, and they are not decorative.
These are asking prices scraped from listing portals, published by a content aggregator that sells property investment products. They are not recorded sales. The publisher does not disclose sample sizes, and the underlying portals block verification.
They are asking prices in a market with 29.6 months of inventory averaged across the first five months of 2026, up from 17.6 months a year earlier, against a local norm the main brokerage puts at 15 to 18 months. In a market that slow, asking prices sit systematically above clearing prices, and the gap is not published.
The aggregator’s citywide average of about US$390,000 sits far below the same period’s closed-sale average of US$568,829 reported by the local brokerage. The two datasets are measuring different markets: the portals capture the peso-denominated domestic segment, the brokerage MLS captures the dollar-denominated foreign-buyer segment. They should never be blended, which is exactly what happens on most neighbourhood pages.
And every figure above spans different products. A range that runs from MXN 5.5m to 12m for a whole colonia is a statement about the mix of what happens to be listed, not a price band for comparable homes.
The appreciation claim does not survive contact with the transaction data
One aggregator published a 12-month appreciation estimate on 19 June 2026 putting Guadalupe at 9 to 12 percent, San Antonio at 10 to 13 percent, Centro Histórico at 9 to 12 percent and the city at 8 to 10 percent.
That set of numbers has no stated measurement method, no disclosed sample and no repeat-sales or hedonic basis. Set it beside what was actually transacted, as reported by the brokerage whose MLS view the whole market relies on:
| Measure | 2024 | 2025 |
|---|---|---|
| Average resale sale price | US$650,462 | US$568,829 |
| Sales above US$2 million | 19 | 12 |
Average sale price fell US$81,633, about 12.6 percent. Active listings rose from 593 in May 2025 to 860 in May 2026, an increase of 45 percent, before falling back to 745 in June 2026 on withdrawals and expirations rather than absorption. The brokerage’s March 2026 update states that in several price ranges months of inventory are as high as they have been since the period following the 2008 financial crisis.
The average price decline is partly a mix effect rather than a pure price effect, since the luxury segment contracted from 19 sales to 12. It should not be published as minus 12.6 percent appreciation. But it is the opposite direction from a 9 to 12 percent gain, and the aggregator lists that same brokerage among its own sources, so it had access to the contradicting data.
The honest position for a publisher with no commission at stake is the flat one: measured appreciation for Guadalupe does not exist. There is no repeat-sales index, no hedonic index and no MLS time series broken out by colonia in the public record. The same applies to days on market. The one citywide days-on-market figure in circulation, around 150 days, cites a brokerage market update that contains no days-on-market data at all. Guadalupe is named in the “60 to 120 days for well-priced homes” version of that claim, which inherits the same defect.
Everything on this page that touches transactions traces to a single brokerage’s own MLS view. There is no public registry in San Miguel de Allende, and deed values recorded at the Registro Público de la Propiedad are not published in aggregate and are commonly understated for tax reasons.
The rental yield claim cannot be checked at all
The strongest version of the Guadalupe thesis is that it produces the best short-term rental gross yield in the city. That claim is not testable. No source publishes short-term rental performance by neighbourhood for San Miguel de Allende. AirROI names eight San Miguel neighbourhoods and keeps the per-neighbourhood metrics behind its paid tier; Guadalupe is not one of the eight it names. Airbtics gates its breakdowns the same way. There is no AMPI, MLS or notary-association dataset of any kind, and every occupancy and rate figure available comes from a listing scraper.
What is published is citywide, and it is sobering.
| Metric, citywide | Value |
|---|---|
| Occupancy | 29.9% |
| Average daily rate | US$210 |
| RevPAR | US$64 |
| Active listings | 2,285 |
| Mean annual revenue per listing | US$17,033 |
| Top 10% of listings | US$5,242+ per month |
| Top 25% | US$2,477+ per month |
| Median listing | US$1,096 per month |
| Bottom 25% | US$446 per month |
| Average booking lead time | 46 days |
| Superhost share | 49.8% |
The median listing grosses roughly US$13,150 a year. The mean of US$17,033 is about 29 percent higher because the top decile drags it up, and quoting the mean alone overstates the typical owner’s outcome by that margin.
An illustration, and it is an illustration rather than a measurement: US$13,150 against Guadalupe’s published asking range of US$315,000 to US$688,000 is between roughly 4 percent and 2 percent gross. That arithmetic joins a citywide median revenue figure to a colonia asking-price range from a different publisher measuring a different segment. It is not a Guadalupe yield. It is the order of magnitude a buyer should be arguing against, before any cost is deducted.
The costs are substantial and mostly documented. A named local brokerage publishes a 20 percent short-term rental management fee; the wider quoted range runs 20 to 30 percent. Guanajuato levies a 4 percent lodging tax under Art. 55 of the Ley de Hacienda, and because the host’s relief is conditional on the platform actually remitting, and the state publicly asserts the platform has not been remitting properly, an owner should assume that 4 percent is their own liability. Above that sits the federal line most often left out of these lists: a furnished letting loses the residential IVA exemption under Art. 20 fracción II of the Ley del Impuesto al Valor Agregado, so 16 percent applies whatever the lease length. That is statute rather than an enforcement position, though whether it is in practice collected from individual foreign owners is undocumented, and no scraper discloses whether the revenue figures above are quoted before or after it. San Miguel de Allende charges MXN 45,000 per fiscal year for the specific land-use permit for lodging, confirmed in Art. 24 fracc. XIV of the 2026 Ley de Ingresos, plus a one-time MXN 11,248.64 for the change of land use. At the ECB reference rate of 17.46 MXN/USD on 23 July 2026, the annual permit alone is about US$2,577, which is roughly a fifth of the median listing’s entire gross revenue.
Two further datapoints deserve to sit next to any yield conversation. Airbtics grades San Miguel de Allende in the lowest 3 percent nationally for short-term rental yield, with revenue up 5.9 percent year on year but down 11.5 percent over three years. And the four scrapers disagree sharply on occupancy: AirROI 29.9 percent, AirDNA 38 percent, GuestFavorites 41 percent, Airbtics 44 percent. None publishes its method for handling blocked calendars, which is almost certainly the source of the divergence. Publish the range, never a point.
Gentrification: measured at the wrong resolution
The best evidence on who buys where in San Miguel is peer-reviewed and carries no commission motive. Navarrete Escobedo’s 2022 study of transnational gentrification found that the seven census tracts inside the UNESCO World Heritage polygon held 1,803 foreign residents, 42 percent of the municipality’s entire foreign-born population of 4,312. Foreigners made up 8 percent of the 22,405 people living in those tracts. The single most concentrated tract was 15 percent foreign; a peripheral south-eastern tract reached 29 percent.
That is real data, and it is at the wrong resolution for this page. Census tracts are not colonias, and the study does not name Guadalupe. It tells you that foreign settlement is concentrated in and immediately around the heritage core and that concentration falls off with distance. It does not tell you which side of a given Guadalupe street has turned.
This matters because the uneven-street-to-street quality of Guadalupe is the single most repeated qualitative observation about it, and there is no dataset in existence that resolves it. A colonia name in San Miguel de Allende is not a market unit. With 18 active listings in one brokerage’s book and no sub-colonia data of any kind, the only instrument available to a buyer is a walk, at night as well as in daylight, on the specific block.
The unflattering items
Water. Caminos de Agua’s monitoring map, as reported in February 2022, places Guadalupe in the middle band, described as moderately contaminated, alongside Obraje, San Antonio and Providencia. Centro sits in the most-contaminated group and Guadiana in the cleanest. That report is four years old, gives no concentrations, no thresholds and no well counts, so treat it as a prompt for a question rather than a finding. The underlying problem is not in dispute: the Cuenca Alta del Río Laja aquifer runs a deficit of about 61.98 million cubic metres a year on CONAGUA’s 2024 determination, with explicitly zero volume available for new concessions, and arsenic and fluoride concentrations rise as the water table falls. Ask what the property is connected to, and ask for a current test.
Security. San Miguel is not insulated from Guanajuato. The municipality recorded 88 homicides between September 2024 and August 2025, a rate of 49.3 per 100,000, ranking it Mexico’s 50th most violent municipality. The trend since has been sharply down, with 3 homicides recorded in the municipality in June 2026 against 45 in León and 32 in Salamanca, and Guanajuato is the state with the steepest decline in the country. But in February 2026 cartel reprisal violence reached roughly 23 Guanajuato municipalities including San Miguel de Allende, with an arson incident on 22 February and a body found on 25 February. Any page telling you San Miguel is unaffected is not describing this place.
Carrying cost. The 2026 municipal revenue law sets predial on urban built property at marginal rates from 0.234 percent up to 0.354 percent of cadastral value. Cadastral values sit far below market, so the effective annual carrying cost is very low by North American standards. What cannot be worked out is the amount, because the municipal tabla de valores unitarios de suelo y construcción, which converts those rates into a per-colonia figure, is not published in the statute and could not be located.
What survives
The location case survives. Guadalupe is flat, it is close to the historic core on every account that exists, and its asking prices sit below Centro’s and Guadiana’s on the only comparative table anybody publishes. For a buyer who wants to walk to the Jardin and cannot or will not pay Centro prices, that is a real proposition.
The character case survives, with the note that it is qualitative. The Fábrica La Aurora cluster and the artistic community are described consistently by independent firms and are visible on the ground. Whether they translate into price is a hypothesis.
The investment case does not survive, because it was never constructed. There is no measured appreciation figure for Guadalupe, no days-on-market figure, no recorded sale price, and no rental performance data at neighbourhood level. The gross yield claim rests on numbers nobody has published. The appreciation claim rests on a modelled estimate that runs opposite to the only closed-transaction series available.
That is not an argument against buying in Guadalupe. It is an argument against buying it as a spreadsheet. The honest framing is that Guadalupe is a plausible place to own a house, priced below the heritage core, in a market where nobody, including this publisher, can tell you what it will be worth.
All conversions at the ECB reference rate of 17.46 MXN/USD on 23 July 2026. Spot rates and annual average rates are different measures and are not interchangeable.
Who buys here
- Buyers priced out of Centro who still want flat access to the historic core
- Owner-occupiers who weight character and location over a documented return
- Renovators comfortable inspecting a specific street rather than a colonia
- Not for buyers who need a measured appreciation or yield track record
Sources
- Realty San Miguel — colonias directory, active listing counts by colonia · 23 July 2026
- Realty San Miguel — monthly market updates: citywide average sale price, months of inventory, active listing counts · June 2026
- TheLatinvestor — price per square metre and whole-property ranges by neighbourhood, asking-price basis · 16 June 2026
- TheLatinvestor — claimed 12-month appreciation by neighbourhood, and gross and net yield ranges · 19 June 2026
- AirROI — San Miguel de Allende short-term rental performance: occupancy, ADR, revenue distribution, seasonality · July 2025 to June 2026
- Airbtics — annual Airbnb revenue and national yield ranking, San Miguel de Allende · February 2025 to January 2026
- Ley de Ingresos para el Municipio de San Miguel de Allende 2026, Decreto 160 (lodging land-use fee, change-of-use fee, predial rates) · Published 30 December 2025, in force fiscal 2026
- Ley de Hacienda para el Estado de Guanajuato, Arts. 52 to 58 (4 percent lodging tax) · Consolidated text 13 November 2025
- Cámara de Diputados — Ley del Impuesto al Valor Agregado, Art. 20 fracción II (furnished lettings and lodging use excluded from the residential-letting exemption, so 16 percent applies) · Última reforma DOF 12 November 2021
- David Navarrete Escobedo, 'La gentrificación trasnacional en América Latina: el caso de San Miguel de Allende', Iztapalapa 43(93), via SciELO México · 2022, using INEGI 2010 and 2020 census data
- The Clark Group — San Miguel de Allende neighbourhoods page (agent-stated walking times and colonia character) · Retrieved 23 July 2026, page undated
- Discover San Miguel de Allende, reporting Caminos de Agua's water-quality monitoring map by colonia · 23 February 2022
- elcri.men analysis of SESNSP and INEGI data, reported by Mexico News Daily (municipal homicide rate) · September 2024 to August 2025
- Periódico AM 'Ejecutómetro' — municipal homicide tallies, Guanajuato · June 2026
- Berkshire Hathaway HomeServices Colonial Homes San Miguel — published short-term rental management fee · Retrieved July 2026
- European Central Bank reference rate for USD/MXN, via Frankfurter · 23 July 2026
Common Questions
Is Guadalupe the best value neighbourhood in San Miguel de Allende?
Nobody can demonstrate that, because the measurement does not exist. San Miguel de Allende has no public property registry, no published MLS statistics and no AMPI data release, so there is no repeat-sales or hedonic index for any colonia. The strongest evidence for Guadalupe is that one aggregator's asking-price table puts it at MXN 35,000 to 60,000 per square metre against MXN 45,000 to 90,000 for Centro Historico, which describes a cheaper entry point rather than a better return. Both figures are scraped from listing portals, not recorded sales.
What does property cost in Guadalupe, San Miguel de Allende?
The only published range is MXN 5.5 million to 12 million, or roughly US$315,000 to US$688,000, from an aggregator working off listing-portal asking prices as of 16 June 2026. The same table gives MXN 35,000 to 60,000 per square metre. These are asking prices in a market carrying 29.6 months of inventory as of the first five months of 2026, which is roughly double what the main local brokerage calls normal, so asking prices in San Miguel are systematically above clearing prices. No recorded sale price for Guadalupe is published anywhere.
Does Guadalupe have the highest short-term rental yield in San Miguel de Allende?
No source publishes short-term rental performance by neighbourhood for San Miguel de Allende, so the claim cannot be verified or refuted. AirROI names eight San Miguel neighbourhoods but keeps per-neighbourhood occupancy and rate behind its paid tier, and Guadalupe is not among the eight it names. Citywide, AirROI reports 29.9 percent occupancy, a US$210 average daily rate and a median listing grossing about US$1,096 a month over July 2025 to June 2026. Airbtics separately grades the whole market in the lowest 3 percent nationally for short-term rental yield.
How far is Guadalupe from the Jardin Principal?
The only published answer is a selling agent's: The Clark Group describes Guadalupe and San Antonio as a 'flat few minutes walk to the center' on an undated page. No source gives a measured distance in metres or a verified walking time for any San Miguel colonia. The one detail worth relying on is the terrain, which three independent brokerages describe consistently: Guadalupe is flat, unlike Atascadero, Ojo de Agua and Balcones, which sit on the hillside. Slope is what turns a stated walking time into a real one.
How much has property in Guadalupe appreciated?
There is no measured figure, and the circulating one is contradicted. An aggregator published a 9 to 12 percent 12-month appreciation estimate for Guadalupe on 19 June 2026 with no stated method, no sample size and no repeat-sales basis. Over the same period, closed-transaction data from the main local brokerage shows the citywide average sale price falling from US$650,462 in 2024 to US$568,829 in 2025 and months of inventory rising from 17.6 to 29.6. The aggregator lists that brokerage among its own sources.
What are the real downsides of buying in Guadalupe?
Three. Gentrification is uneven street to street and no dataset resolves below census-tract level, so a colonia-wide description tells you nothing about a specific block. Guadalupe sits in the middle band of Caminos de Agua's colonia water-quality monitoring, described as moderately contaminated in a 2022 report that publishes no concentrations or thresholds. And the investment case rests on qualitative evidence: the arts cluster, the flat access, the price gap to Centro. None of that is a measured return.
San Miguel de Allende · Heritage Equity
The report no agent will send you.
The SMA Wealth Intelligence Report. Transaction data, neighbourhood appreciation, and the full short-term rental yield distribution. No commission agenda, because we do not earn one.